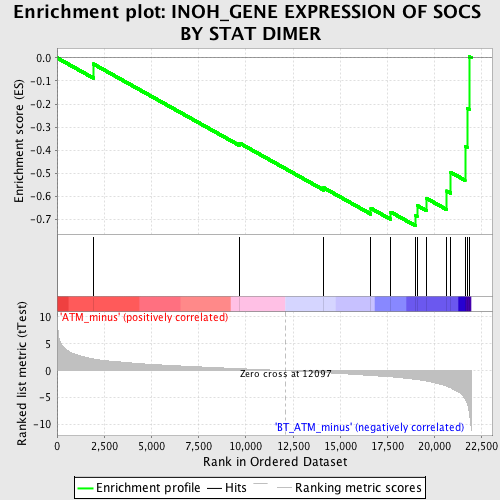
Profile of the Running ES Score & Positions of GeneSet Members on the Rank Ordered List
| Dataset | Set_02_ATM_minus_versus_BT_ATM_minus.phenotype_ATM_minus_versus_BT_ATM_minus.cls #ATM_minus_versus_BT_ATM_minus.phenotype_ATM_minus_versus_BT_ATM_minus.cls #ATM_minus_versus_BT_ATM_minus_repos |
| Phenotype | phenotype_ATM_minus_versus_BT_ATM_minus.cls#ATM_minus_versus_BT_ATM_minus_repos |
| Upregulated in class | BT_ATM_minus |
| GeneSet | INOH_GENE EXPRESSION OF SOCS BY STAT DIMER |
| Enrichment Score (ES) | -0.7276891 |
| Normalized Enrichment Score (NES) | -1.8930331 |
| Nominal p-value | 0.004140787 |
| FDR q-value | 0.050753813 |
| FWER p-Value | 0.276 |
| PROBE | DESCRIPTION (from dataset) | GENE SYMBOL | GENE_TITLE | RANK IN GENE LIST | RANK METRIC SCORE | RUNNING ES | CORE ENRICHMENT | |
|---|---|---|---|---|---|---|---|---|
| 1 | SOCS6 | 1435492_at 1450129_a_at 1452764_at 1459350_at | 1919 | 2.178 | -0.0263 | No | ||
| 2 | SOCS5 | 1423349_at 1423350_at 1441640_at 1442890_at | 9668 | 0.376 | -0.3691 | No | ||
| 3 | SOCS4 | 1421273_at 1421274_at 1421275_s_at 1455142_at | 14127 | -0.347 | -0.5627 | No | ||
| 4 | STAT3 | 1424272_at 1426587_a_at 1459961_a_at 1460700_at | 16620 | -0.890 | -0.6513 | No | ||
| 5 | STAT4 | 1448713_at | 17670 | -1.132 | -0.6673 | No | ||
| 6 | SOCS7 | 1420766_at 1434834_at 1438492_at 1455402_at | 18994 | -1.621 | -0.6821 | Yes | ||
| 7 | STAT1 | 1420915_at 1440481_at 1450033_a_at 1450034_at | 19065 | -1.647 | -0.6389 | Yes | ||
| 8 | SOCS3 | 1416576_at 1455899_x_at 1456212_x_at | 19575 | -1.903 | -0.6086 | Yes | ||
| 9 | SOCS2 | 1418507_s_at 1438470_at 1441476_at 1442586_at 1446085_at 1449109_at | 20642 | -2.880 | -0.5762 | Yes | ||
| 10 | STAT5A | 1421469_a_at 1450259_a_at | 20852 | -3.200 | -0.4957 | Yes | ||
| 11 | STAT2 | 1421911_at 1450403_at | 21604 | -5.204 | -0.3836 | Yes | ||
| 12 | STAT5B | 1422102_a_at 1422103_a_at | 21715 | -6.071 | -0.2178 | Yes | ||
| 13 | SOCS1 | 1440047_at 1450446_a_at | 21837 | -8.094 | 0.0044 | Yes |

